Get started with Data Explorer
Categories:
Prior reading: Data Explorer overview
Purpose: This document walks through the basic features of Data Explorer, including how to create cohorts, review cohort participants, and export a data snapshot.
Introduction
This guide shows you the basic features of Data Explorer so that you can start working with datasets for detailed analyses.
Interactive tutorial
Learn how to create cohorts and data snapshots with this interactive tutorial.
Create a cohort from a Workbench workspace
Cohorts are controlled resources in Workbench that can be created right in your workspace.
Prerequisites
You'll need to have Owner or Writer access to a Workbench workspace, as well as Reader access to a data collection in Workbench that supports data exploration.
Step-by-step guide
1. Create a cohort
This video shows you how to create a cohort from a workspace. Detailed steps can be found below.
-
Log in to Workbench and select the workspace where you want to create a cohort.
-
In the workspace, select the Resources tab. Select + New resource and choose New cohort.
-
Complete the three dialog screens.
The first dialog screen lists data collections that you have Reader or Owner access to. Select the data collection you'd like to use. If the collection has different versions, a dropdown will appear on the right side. The latest version will be selected by default, but you can select another version. Click Next.
Note
If you don't see any data collections, please reach out to your Workbench contact to gain access.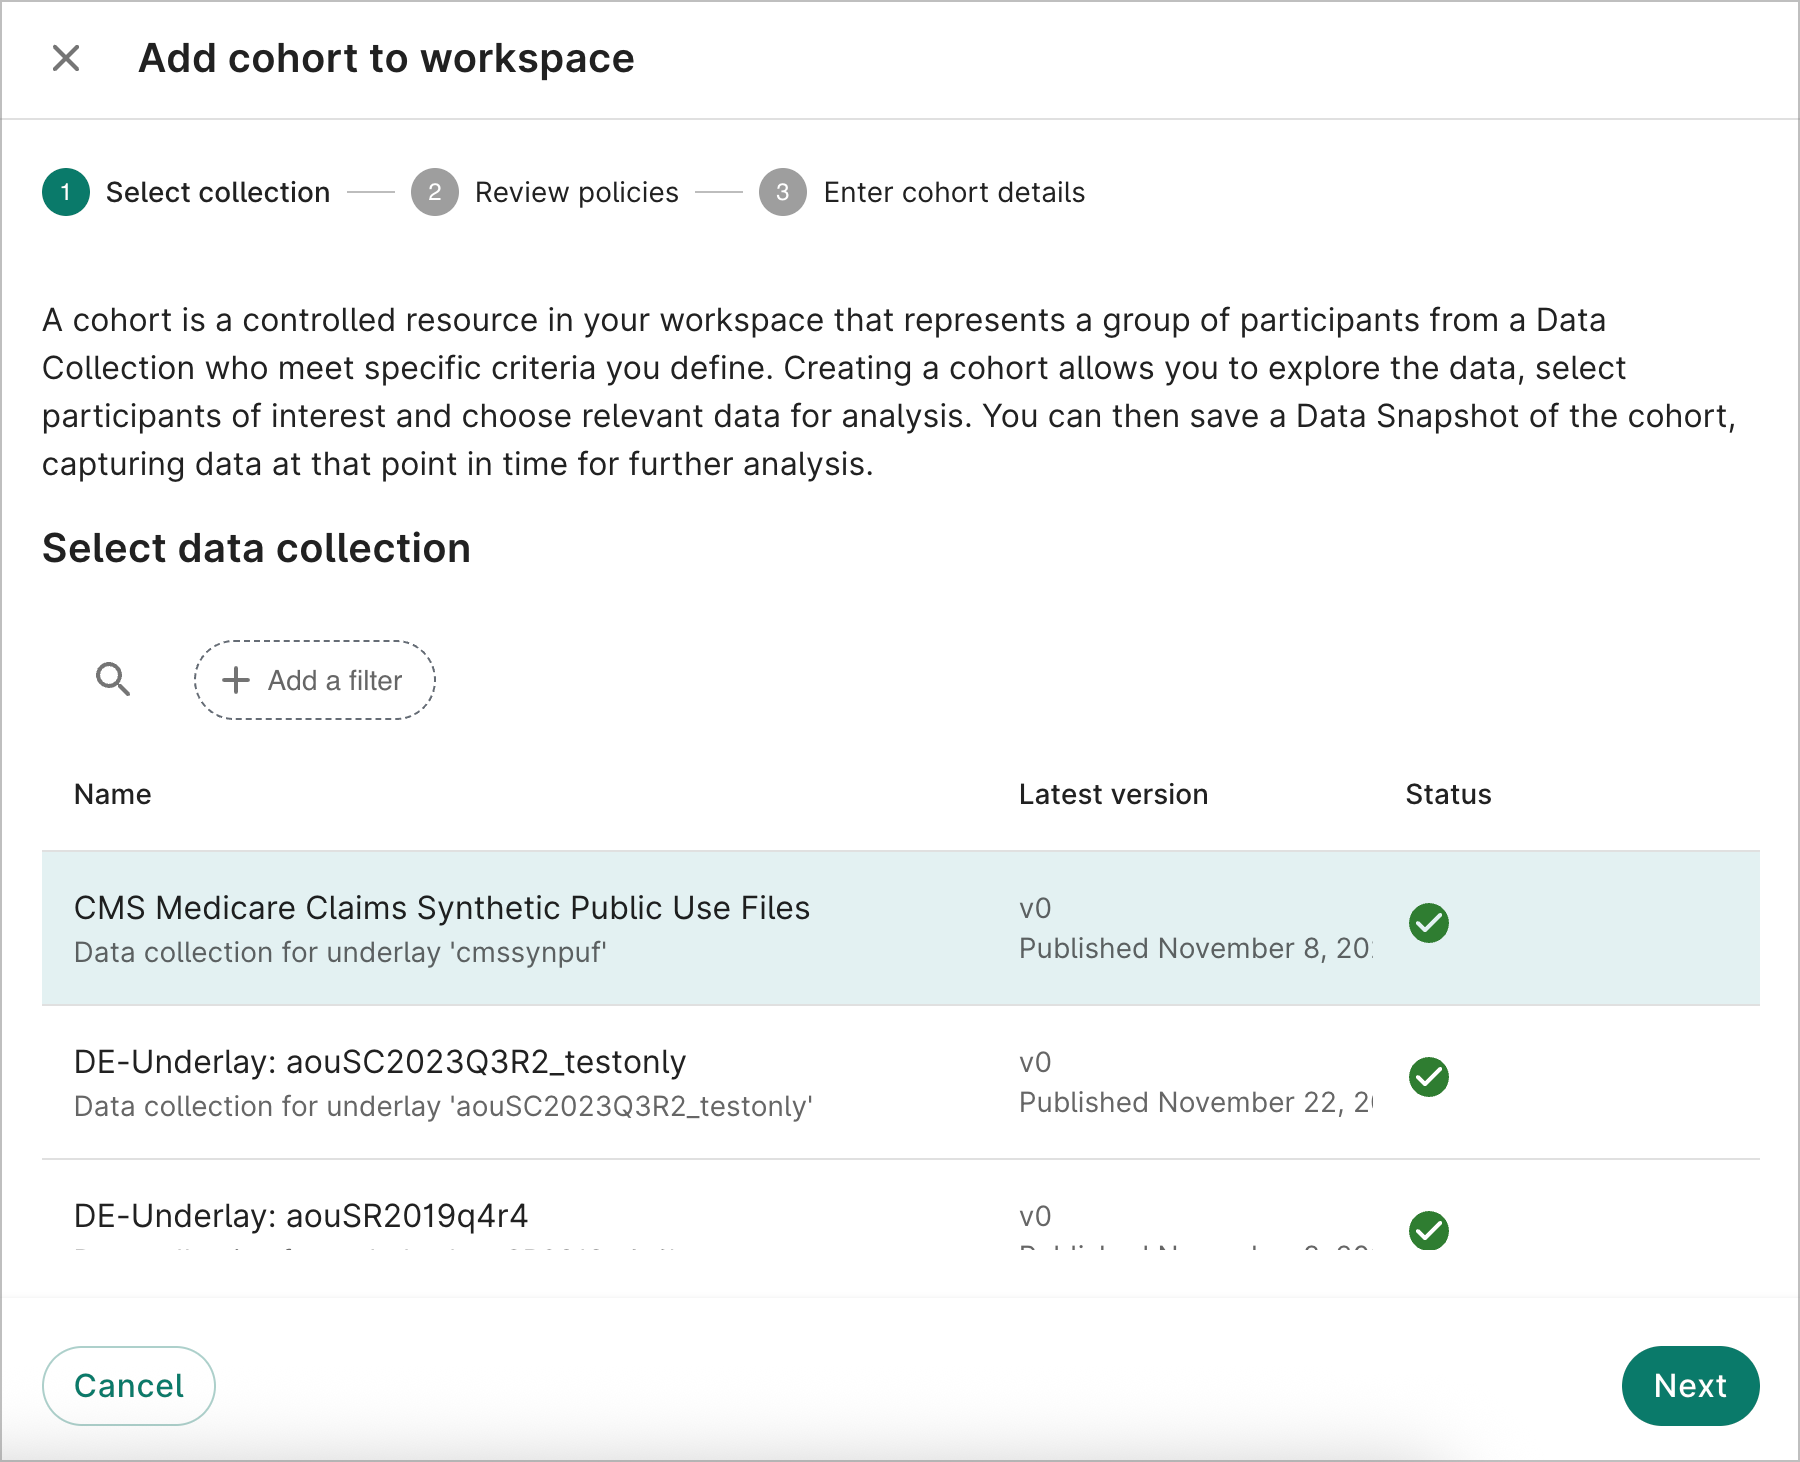
The selected data collection has multiple versions. Users can use the dropdown to specify which version they want to use for their cohort. The second dialog screen will describe the policies and terms that are associated with the selected data collection. If you agree, check the "I'm sure" statement and select Next.
Be aware
Any policies and terms associated to the selected data collection will also be applied to the workspace itself. This could potentially limit workspace access to some users.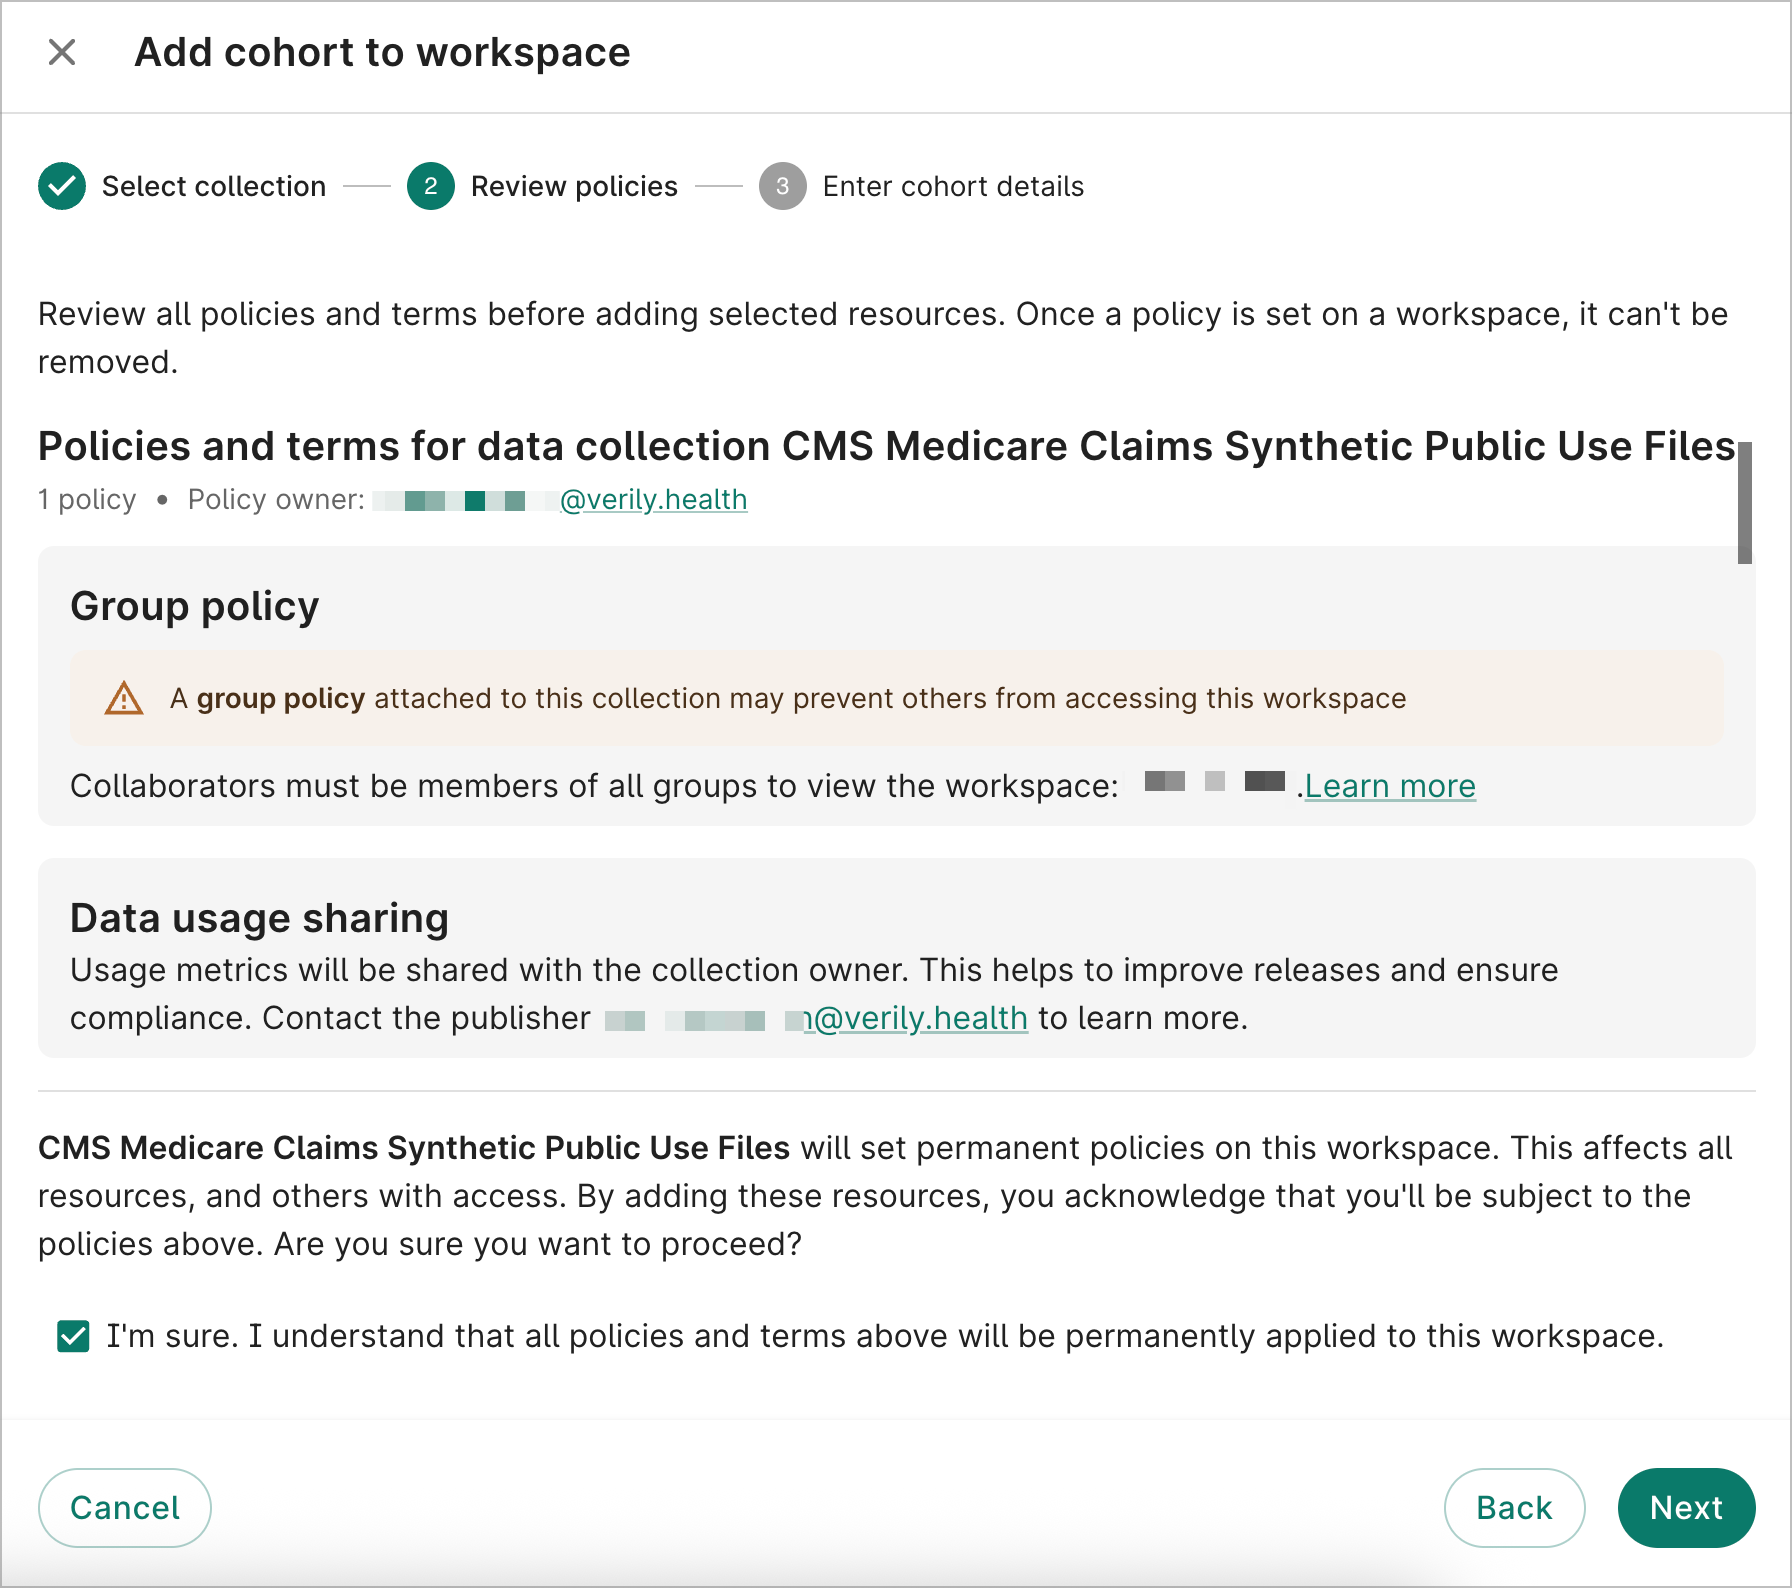
On the third dialog screen, enter a cohort name and an optional description. Select where you'd like to add this cohort and choose Add to your workspace.
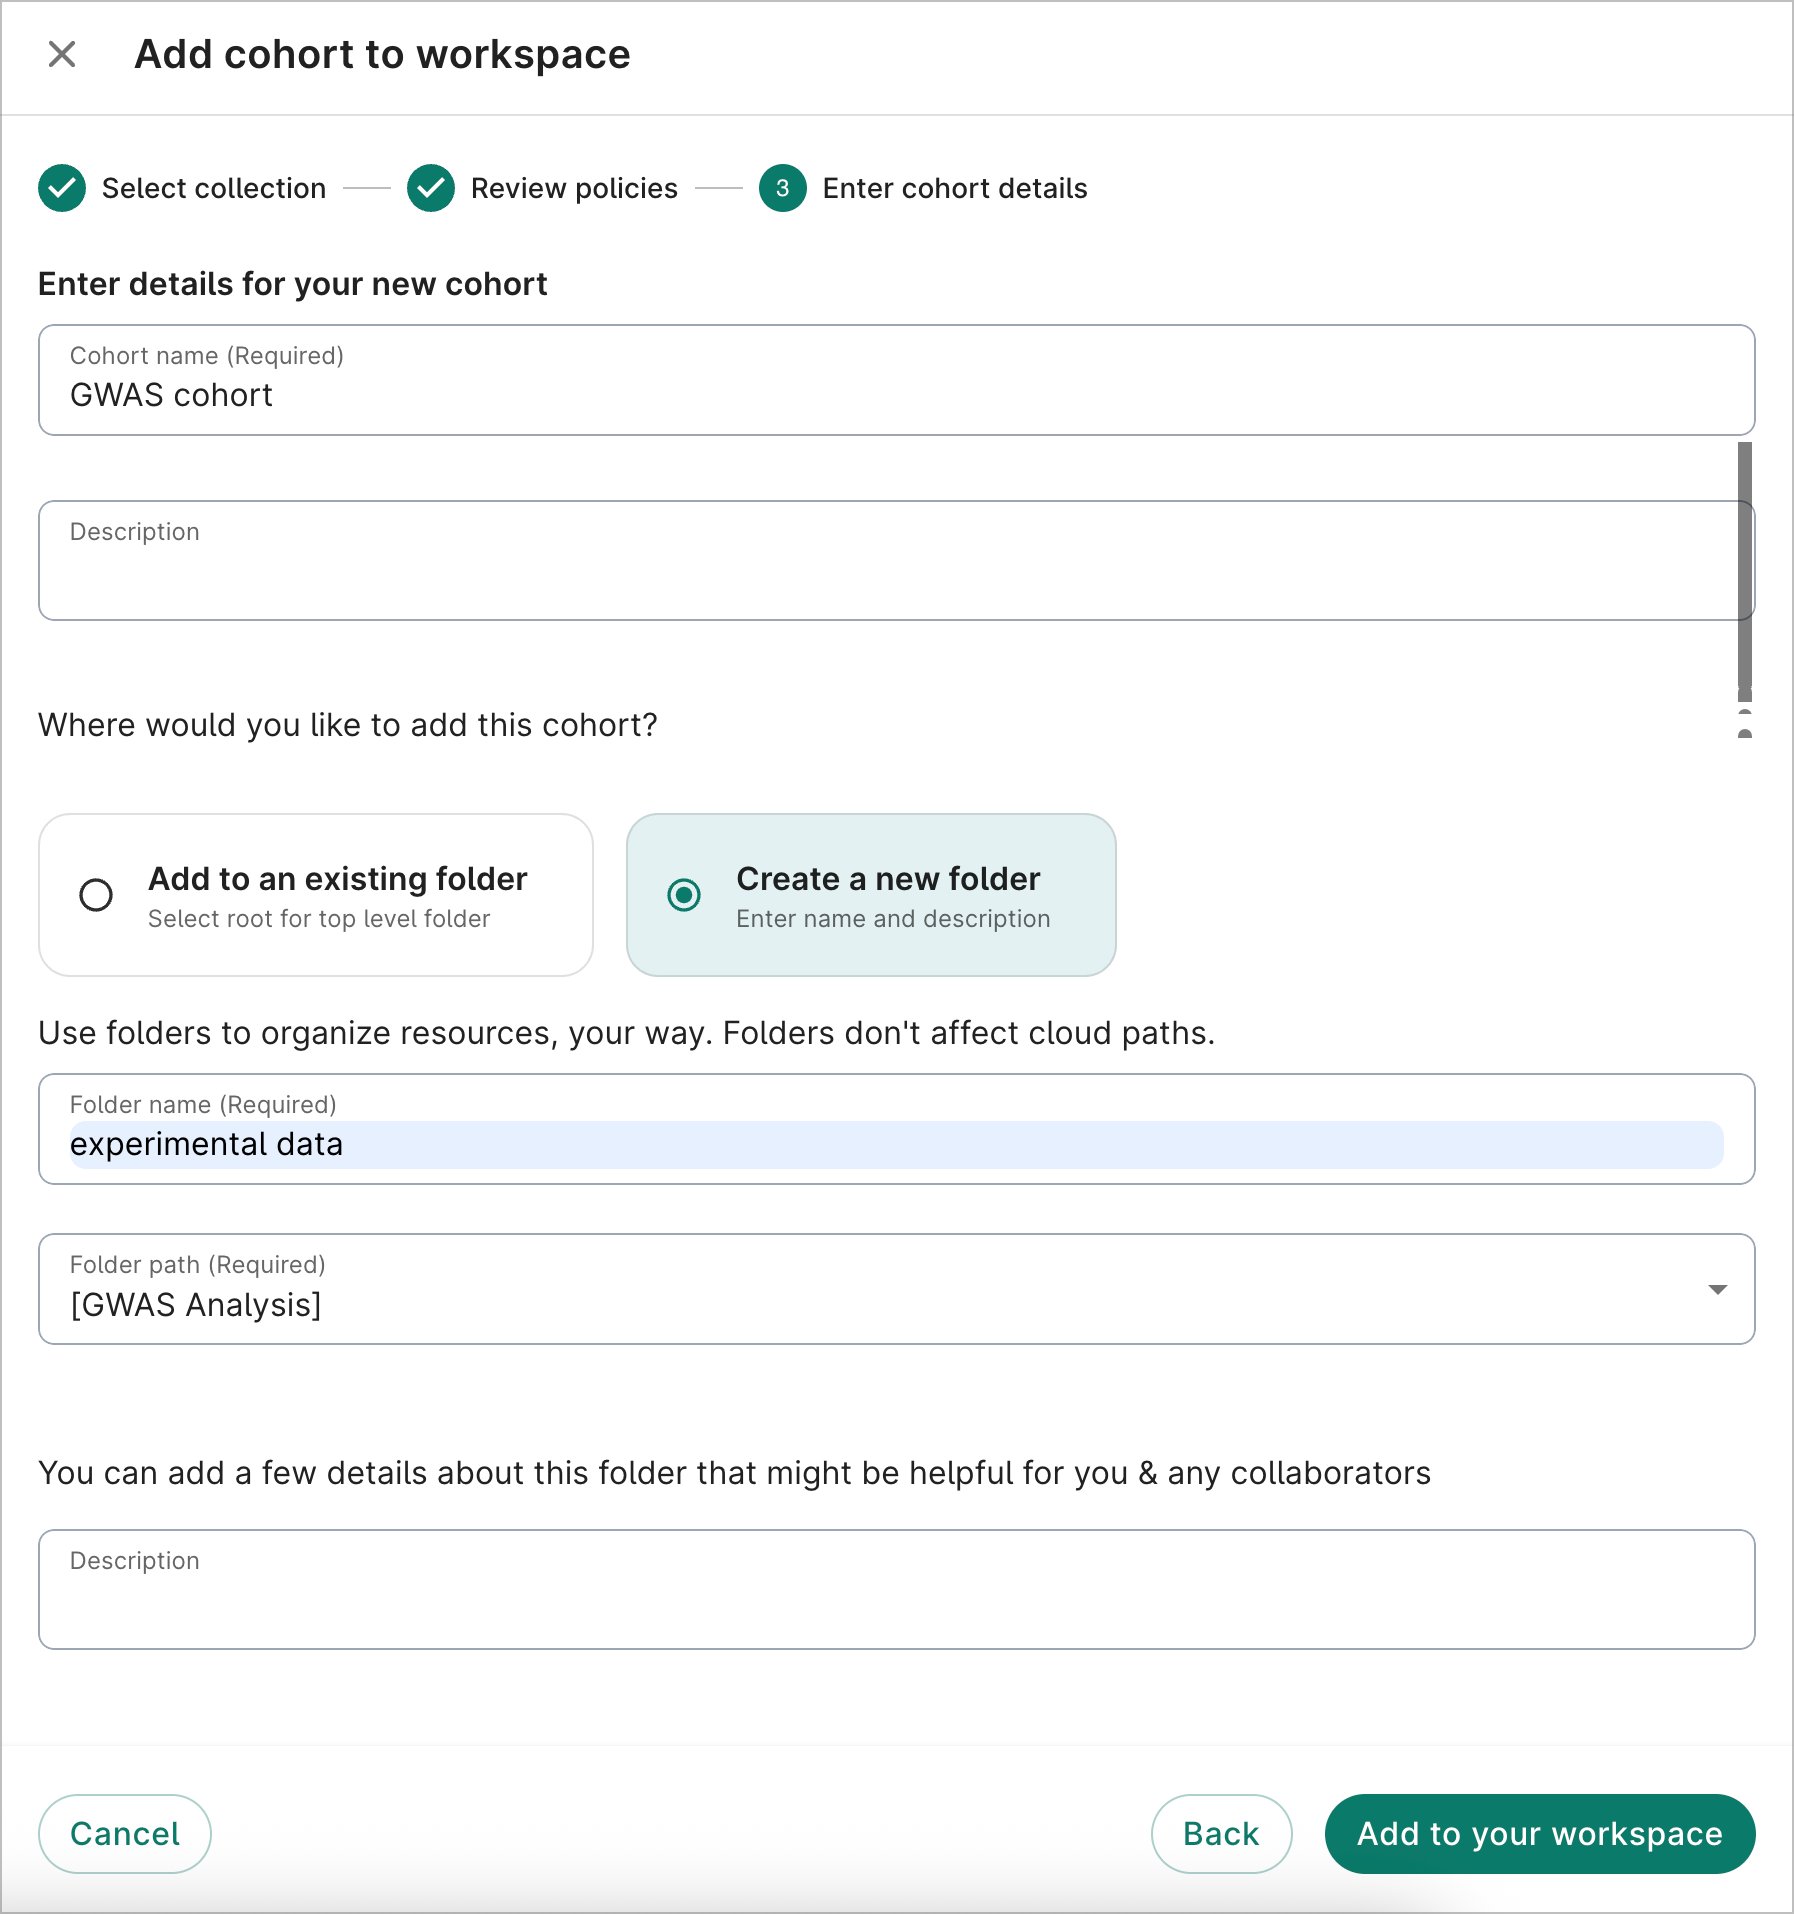
On successful creation, you'll see your new cohort in the Data Explorer cohort builder screen.
2. Define criteria
Get the specific data you need by selecting criteria based on demographics, conditions, procedures, and more.
This video shows how you can work with cohorts in your workspace. Detailed steps can be found below.
-
In the Resources tab, select your new cohort and select Open. A page will open showing the Cohort filter and Cohort visualizations.

-
With the Cohort filter, you can create one or more groups based off of certain criteria. Give the group a name. Select Add some criteria to display the various filter options. You can type in your criteria or explore various domain, program data, or source code fields.
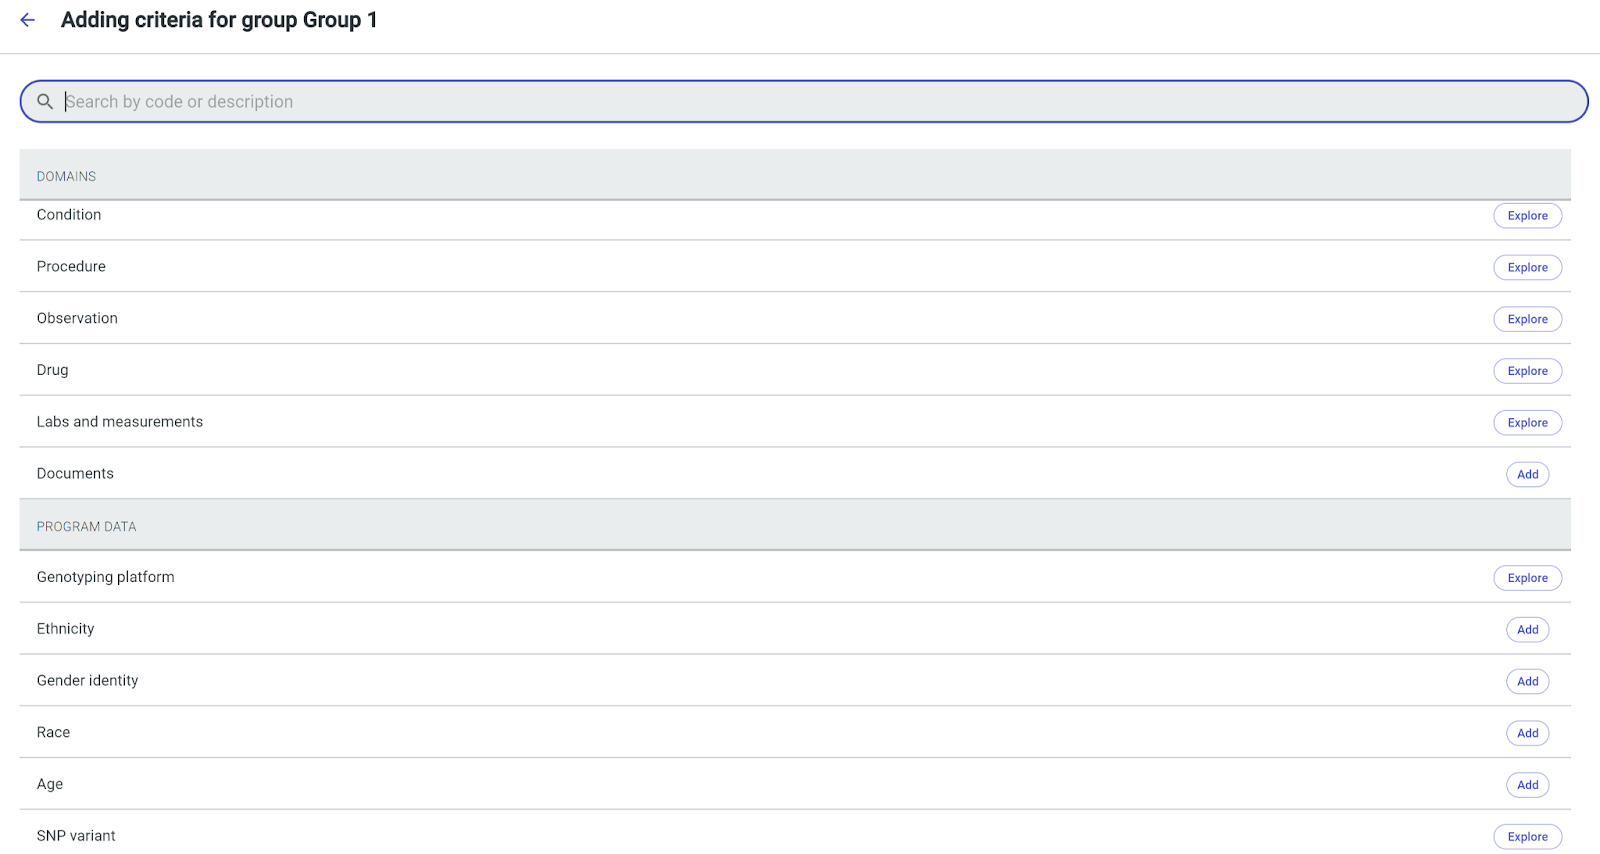
-
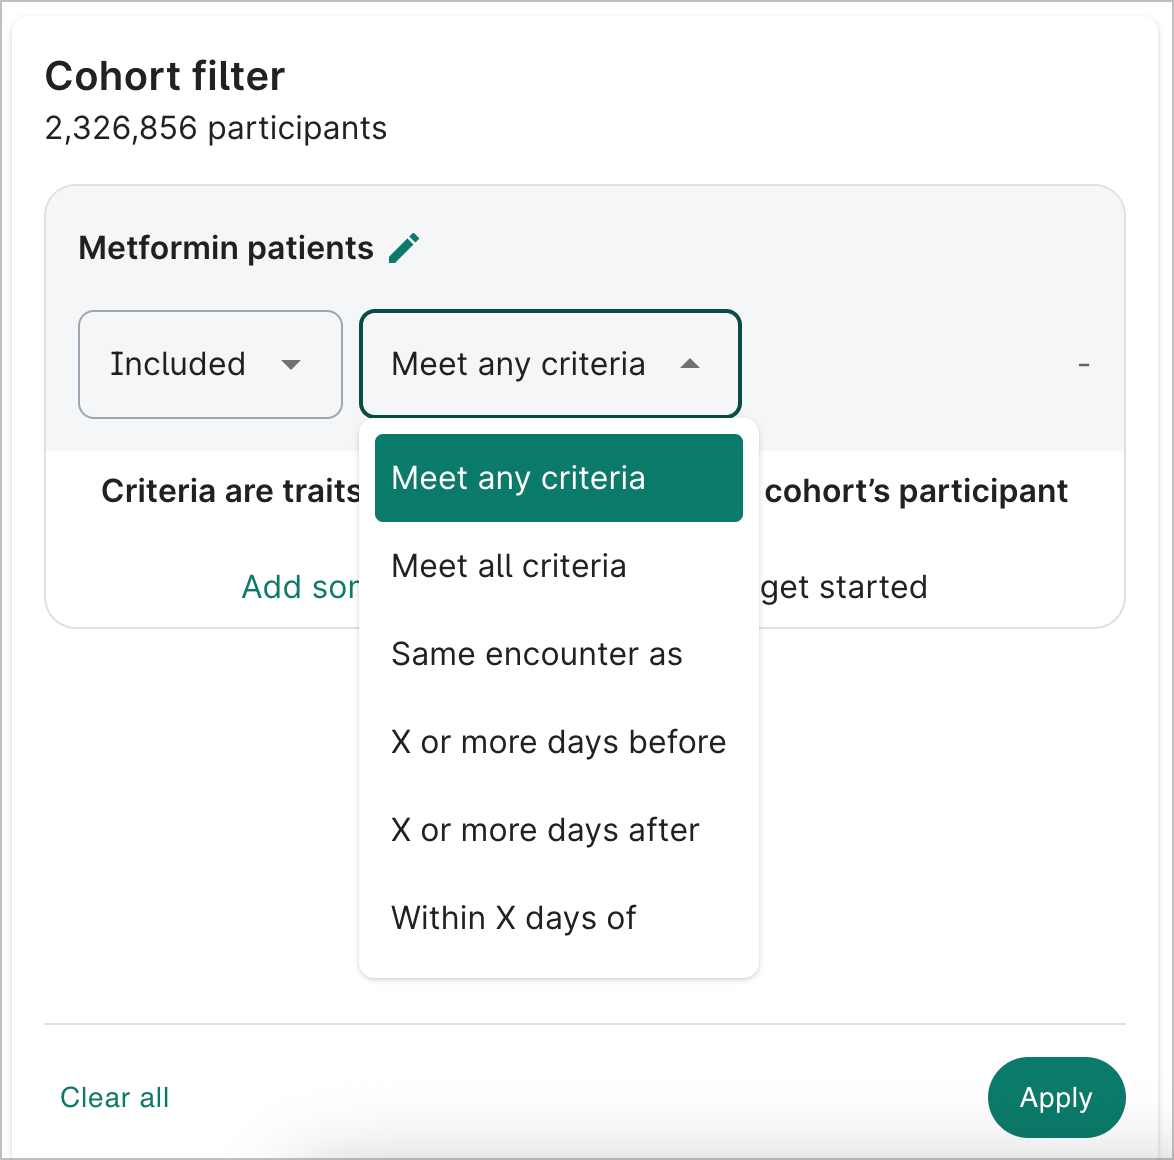
Refine your search using the two dropdowns in the Cohort filter section. One dropdown allows you to include or exclude your selected criteria in the results.
The other dropdown gives you options to display results that meet any criteria (which triggers the "or" operator) or meet all criteria (which triggers the "and" operator).
This dropdown also includes several temporal options that only work with certain criteria such as condition or procedure criteria. If you’d like to filter your cohort by other criteria, such as ethnicity or age, create another group. Note that you can only use the AND operator when working with multiple groups.
Note
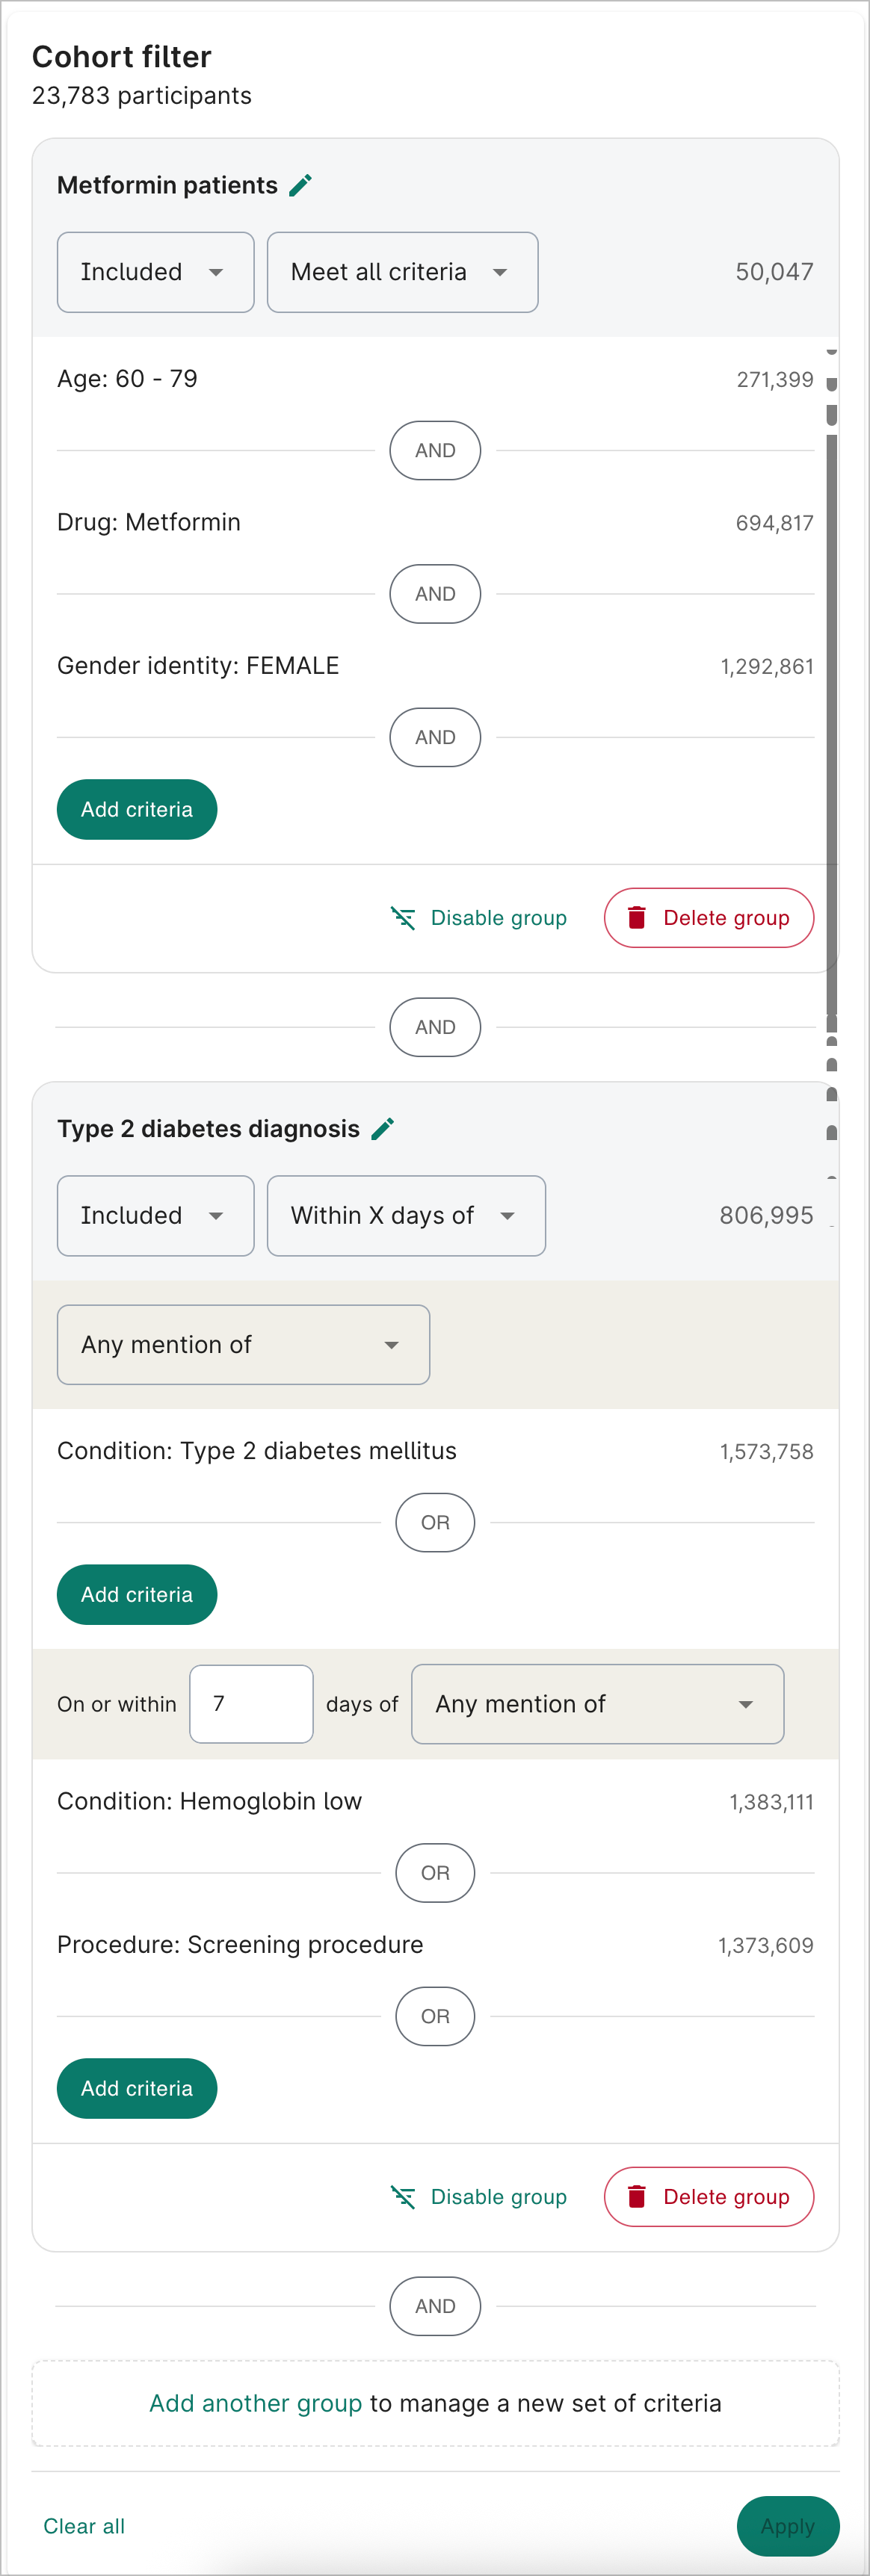
Cohorts autosave, including when you rename the cohort and any cohort filter groups.In this example, we’ll narrow down the participants by selecting only those who are female, age 60–79, and taking Metformin, and who also have type 2 diabetes mellitus within seven days of any screening procedure or mention of low hemoglobin. Note how for the temporal filter, we created a separate group for the type 2 diabetes, screening procedure, and low hemoglobin criteria.
-
As you select criteria, the cohort visualizations will update to reflect the results. You can hover over the bars to see a more detailed breakdown.
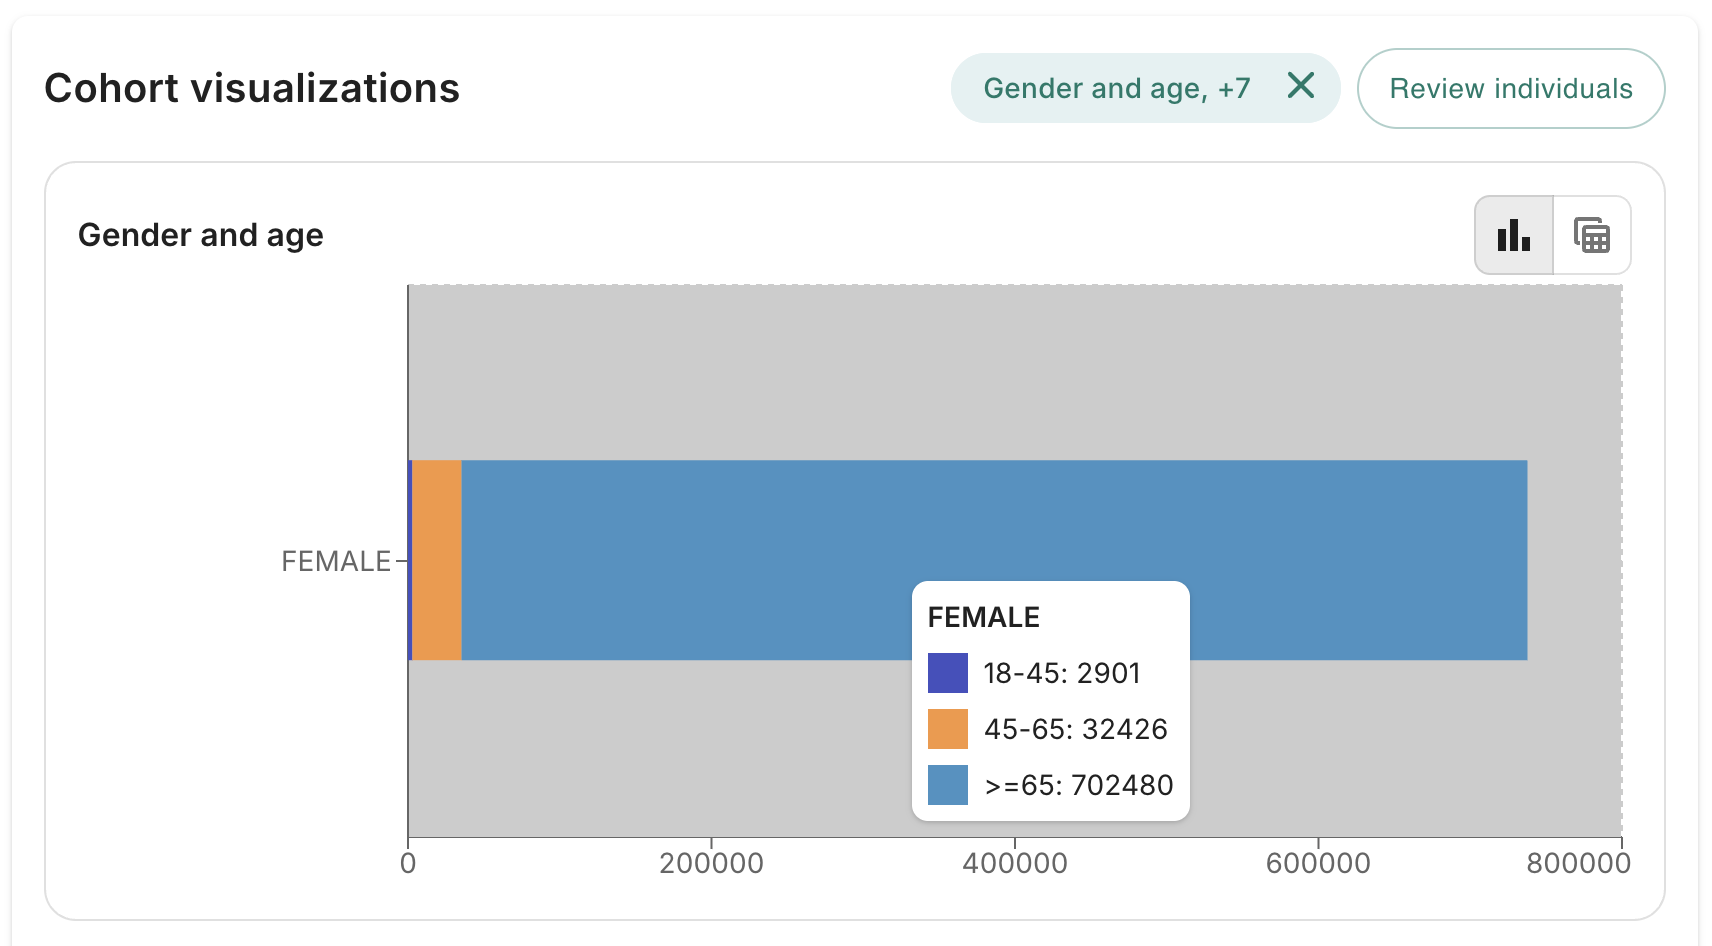
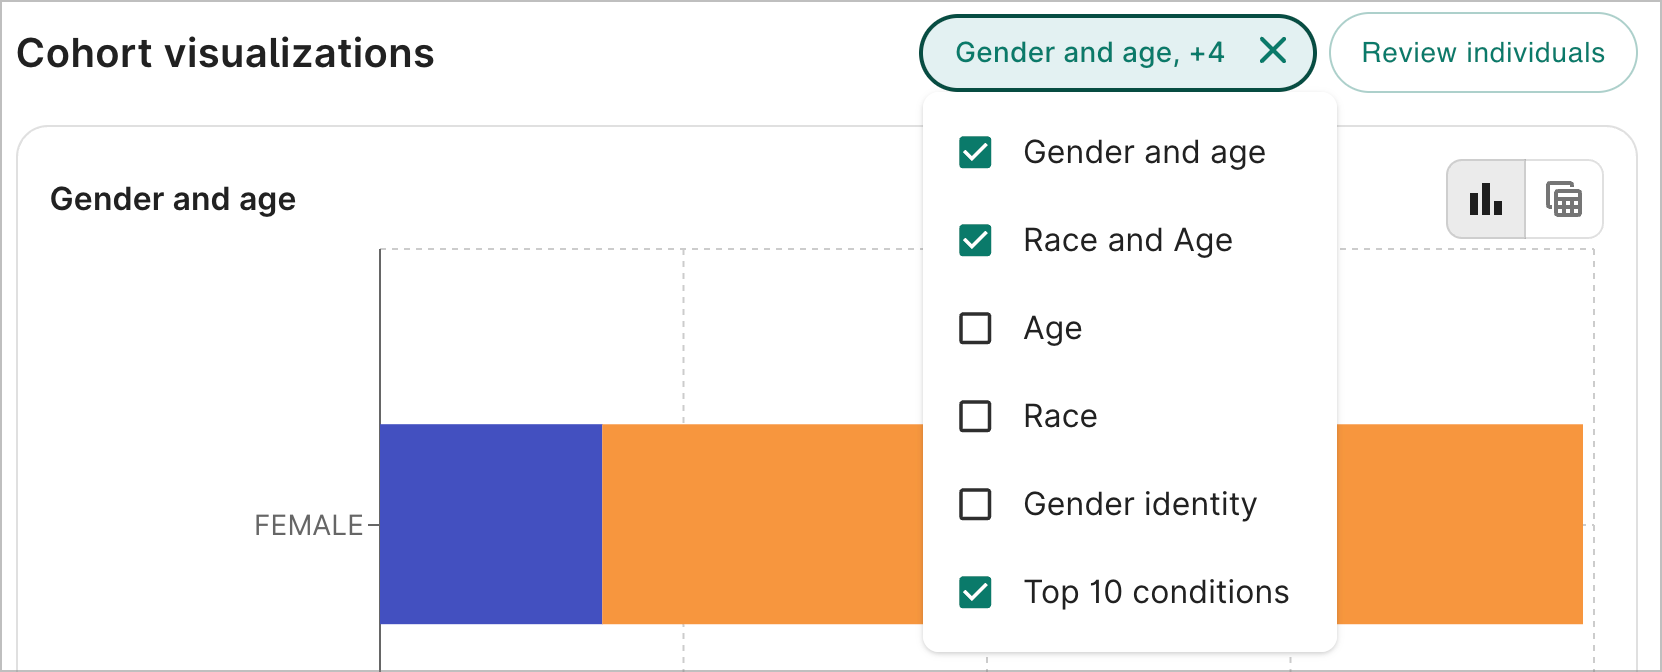
A detailed breakdown appears when you hover over a bar in the visualization chart. The default visualization view is bar charts. In the upper right corner of each visualization, you can toggle between bar chart and table view. In the upper right of the Cohort visualizations section, you can turn certain charts on or off.
3. Review participants
Once you’ve created your cohort, you can view review individual participants, view cohort statistics, and create annotations to share with collaborators.
-
In the Cohort visualizations section, select Review individuals. This will take you to a Reviews page.
-
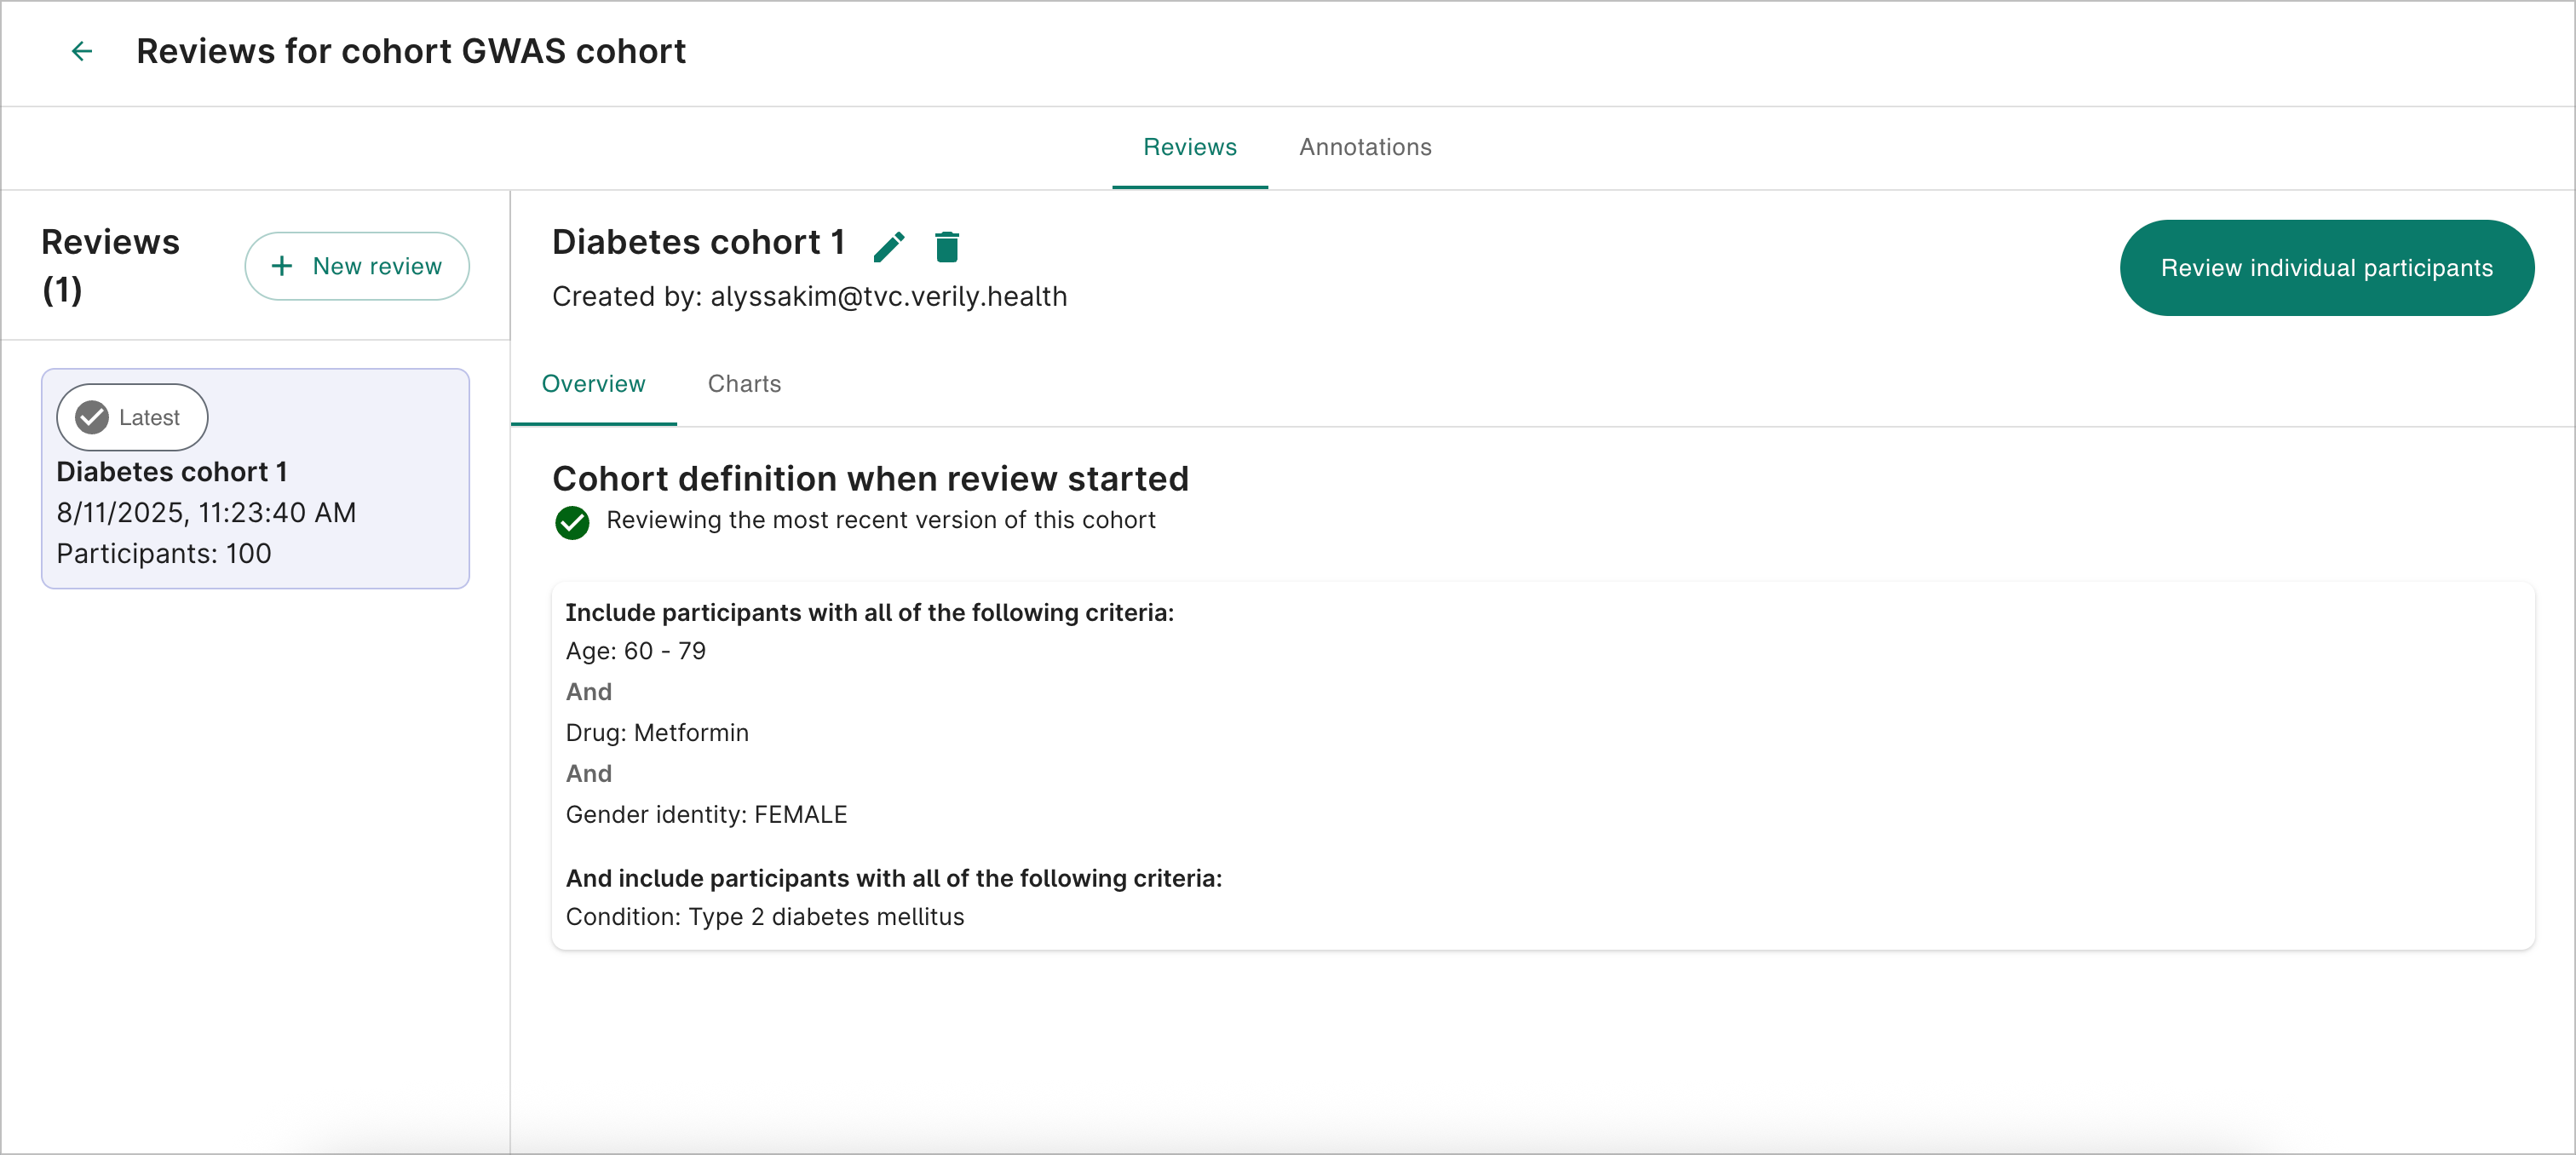
Select + New review and enter a name for your cohort review and the number of participants you want to review. Note that the maximum participant count is 100. Select Create. It will take a few moments to create the review. Once it's created, you'll see an Overview tab summarizing your cohort criteria and a Charts tab that shows the cohort visualizations.
-
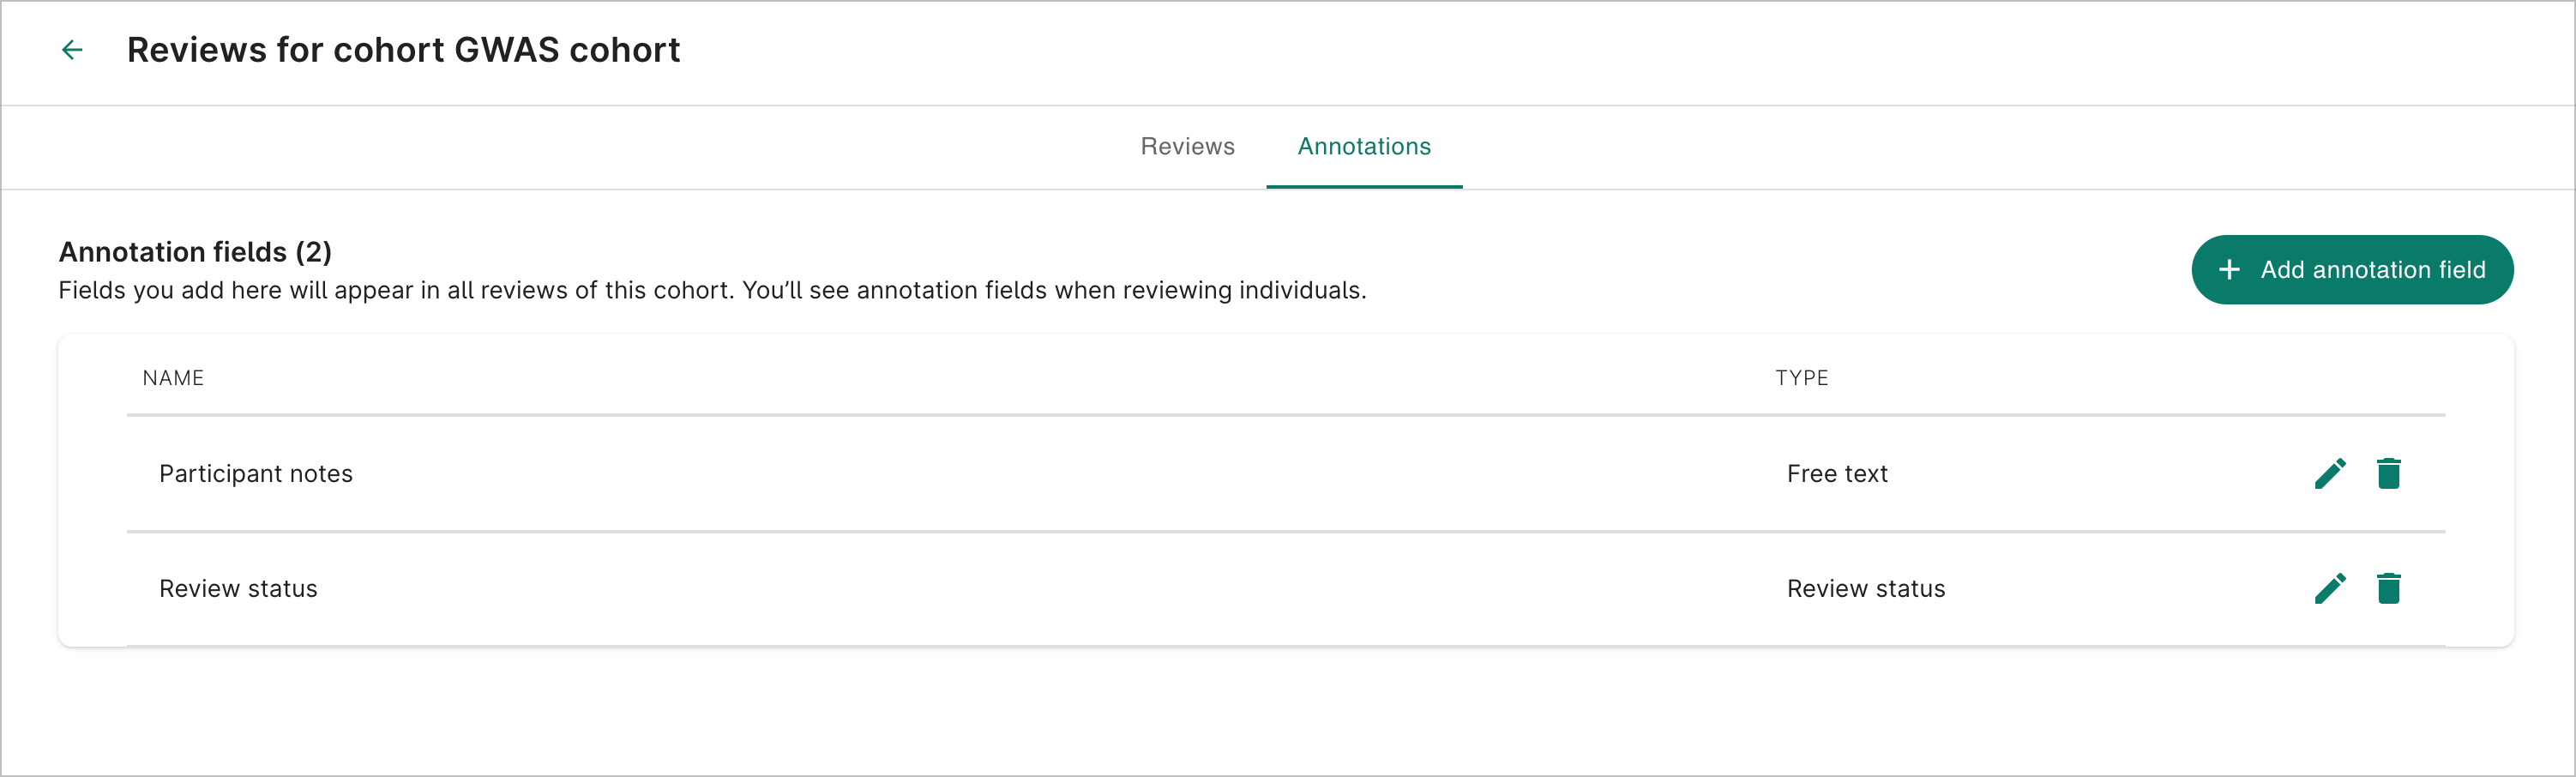
To make notes about individual participants, you'll first need to set up annotation fields. Select the Annotations tab and then + Add annotation field to create preset fields. You'll see two preset fields:
- Free text allows you to enter any sort of annotations.
- Review status will present a dropdown with Included, Excluded, and Needs further review options.
For all presets, you need to enter a display name for each annotation field. In this guide, we'll create one Free text preset named "Participant notes" and one Review status preset named "Review status."
-
Return to the Reviews tab and select Review individual participants. You can view an individual's conditions, procedures, observations, and drugs.
On the left-hand side, you’ll see demographic information about the participant, as well as an Annotations section with the annotation fields you previously created. Select the arrow buttons to navigate to different participants. You can also view a specific participant by selecting the hamburger menu to see the full list of participants.
Any annotations you make will be saved automatically.

4. Create a data snapshot to export
Now that you’ve created a cohort with your desired criteria, you can build a data snapshot to export and further analyze your data.
-
Navigate to the Resources tab in your workspace and select your cohort. Select Transfer data to open the Transfer cohort data to workspace dialog.
-
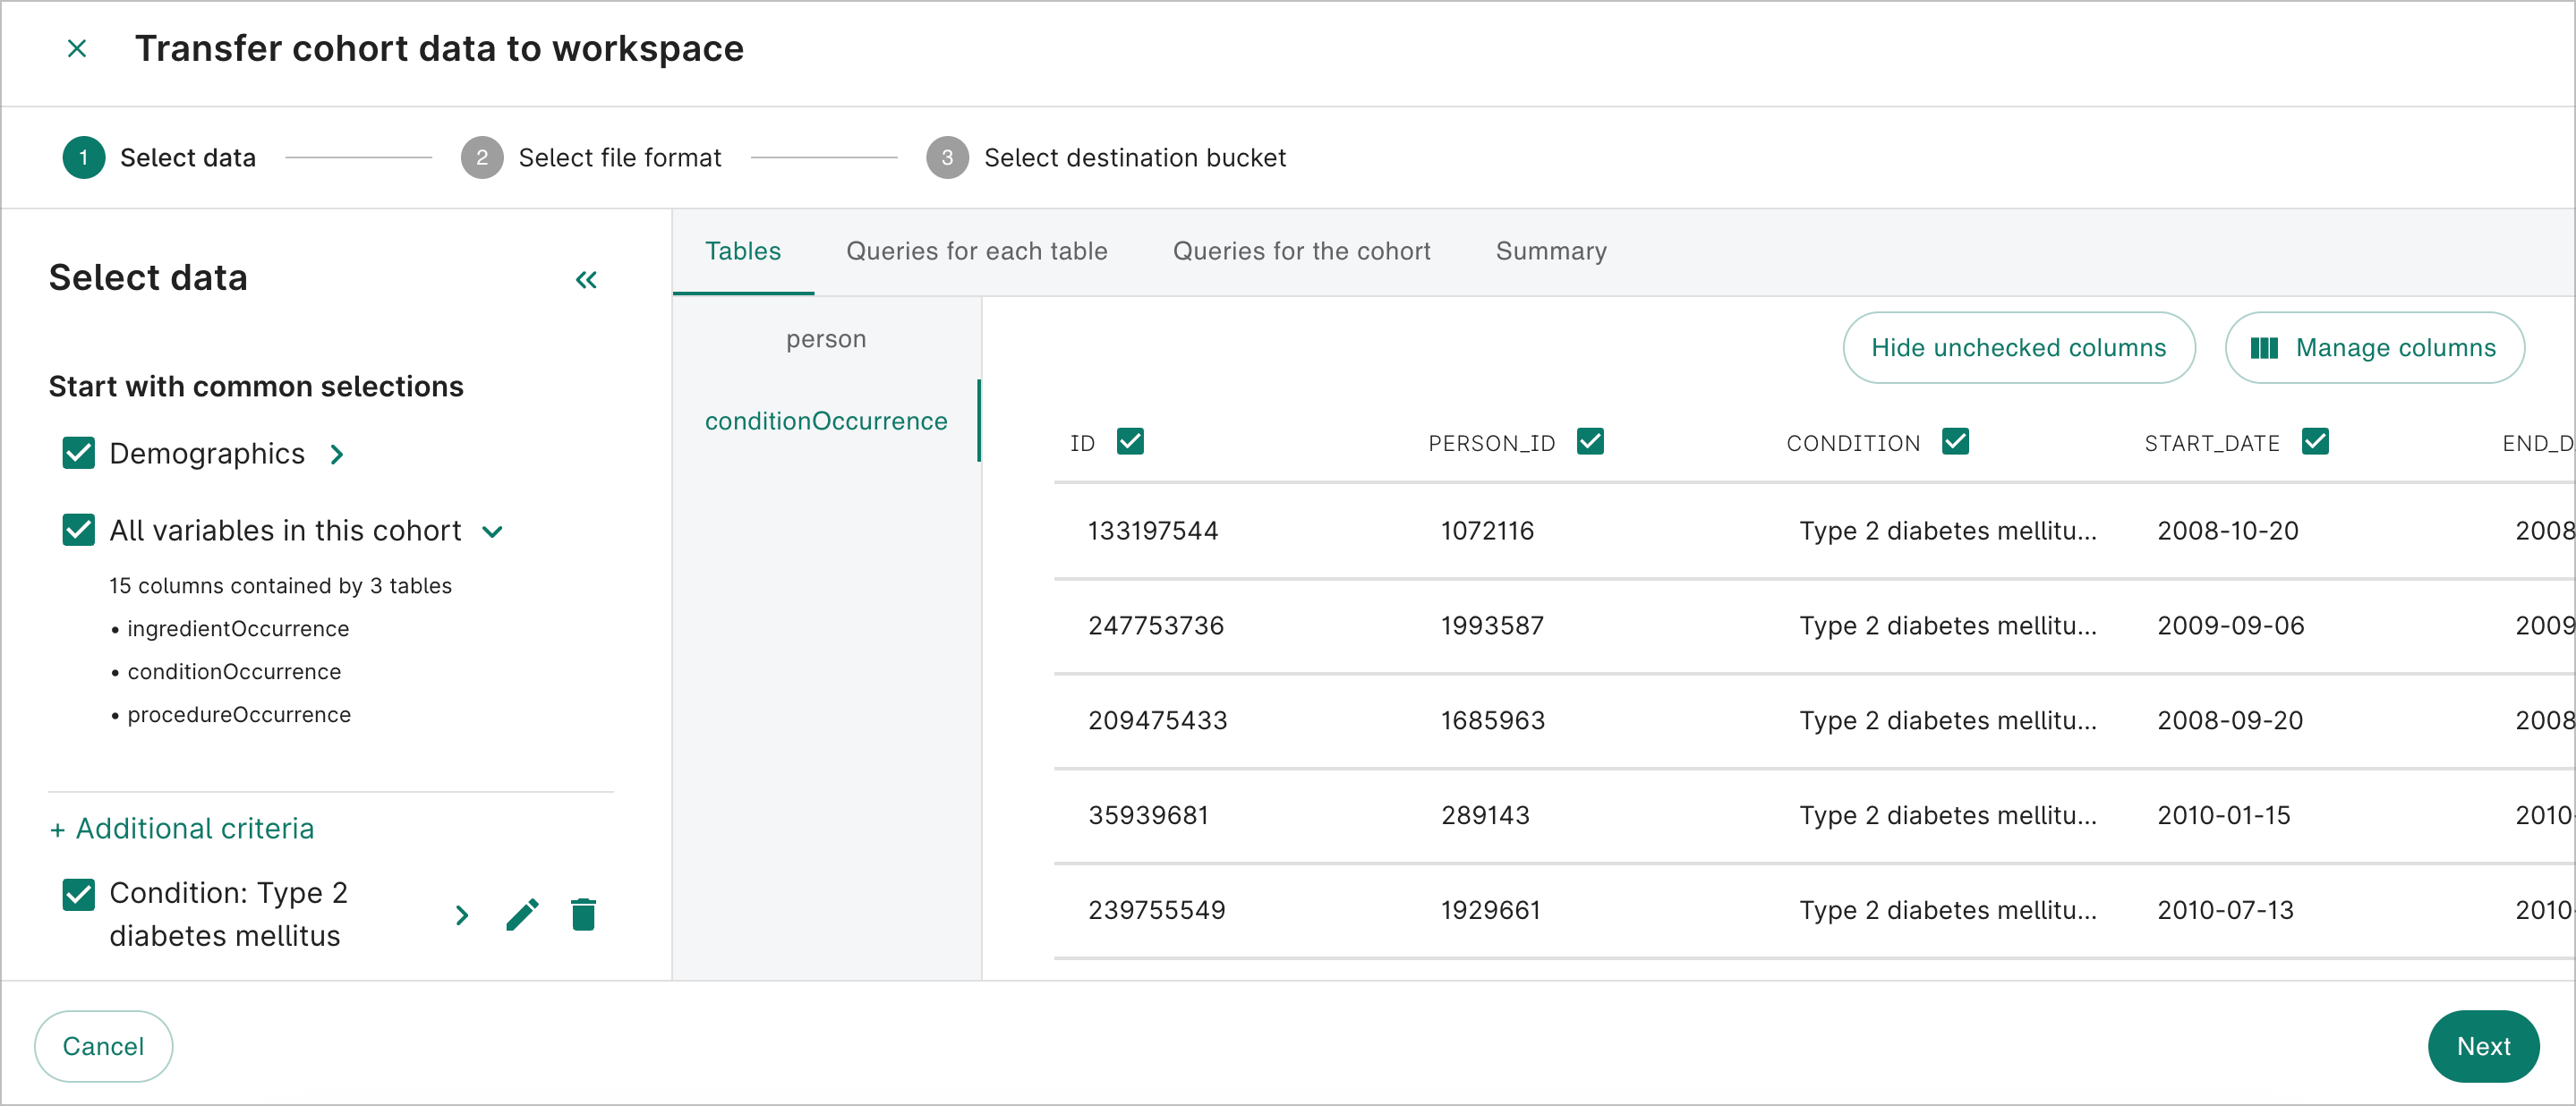
The first step involves selecting the data you want to export. You'll be shown the table data and columns available for export. By default, all table columns will be selected, but you can deselect any you want to exclude by either using the checkbox feature next to a column name or by selecting Manage columns and using the toggle function.
You can also select additional criteria to include in the data export. In addition, you can view queries for each table and for the cohort.
In this example, we'll add the "Type 2 diabetes mellitus" condition as additional criteria. You can see that there are tables for person and conditionOccurrence available for export.
SQL queries will be generated for each table and the cohort. You can view and copy these in the Queries for each table and Queries for the cohort tabs.
Select the Summary tab to see the selected criteria and the table(s) and column(s) that will be included in your export. Select Next.

-
Next, select the files you'd like to export. Tables can be exported as a zipped or unzipped CSV file. Queries for the cohort are available in Python or R. Select Next.
-
Finally, you'll be asked to choose a destination bucket for the data export. You can choose an existing bucket or create a new one. Select Export. Once the data export is complete, you'll be redirected to the Resources tab in your workspace.
5. Work with your data
-
From your workspace's Resources tab, select the bucket that you specified in the data export. Select Browse.
-
You'll see a list of the exported data files. Select a file to view its details, download it, or add it as a reference.
-
With the files already in your workspace, you can work with them in your cloud app.
Note
If you selected zipped CSV files, you'll have to decompress them before they can be used for analysis.Other actions
Cohorts are controlled resources. From the Resources tab, you can move, edit, and delete your cohort. You can also view details and lineage information about the cohort by selecting it from the Resources tab.
Last Modified: 20 May 2026