View and export application instance logs
Categories:
Prior reading: Cloud apps overview
Purpose: This document provides detailed instructions for viewing logs for your Workbench cloud app.
Introduction
Workbench users can view and export application instance logs for Amazon Web Services (AWS) and Google Cloud Project (GCP) cloud apps via the Workbench web UI and the Workbench CLI.
How to use logs
Application instance logs can help you debug custom container failures and diagnose runtime or performance issues, especially if you're seeing "out of memory" errors or if a custom app is failing to start. The logs can also help determine the approximate memory a workload needs or the right virtual machine (VM) size for a workload.
The following types of logs are available to view:
- Application logs: Docker logs from the
application-servercontainer running JupyterLab, R Analysis Environment, or your custom application - Startup logs: Logs pertaining to setting up the
application-servercontainer - System logs: systemd unit logs
- VM statistics: Memory and disk usage
You can use the text filter to search by log name to retrieve specific log streams:
- Application logs:
vm.docker - Startup logs:
vm.journal.startup - System logs:
vm.journal., e.g.,vm.journal.idle-shutdown.service - VM statistics:
vm.journal.stats
Note
Workbench app log retention is 30 days.
In GCP-backed workspaces with a perimeter, only
vm.journal.stats and vm.journal.startup logs will be exposed.
View and export logs
-
From a workspace, navigate to the Apps tab to see your cloud apps. Click the three-dot icon in the upper-right corner of a cloud app card and select View logs. An App logs dialog will open.

Select View logs from the cloud app card. -
Adjust the query filters by date/time, text, and/or severity and click Query. Relevant logs will appear below.
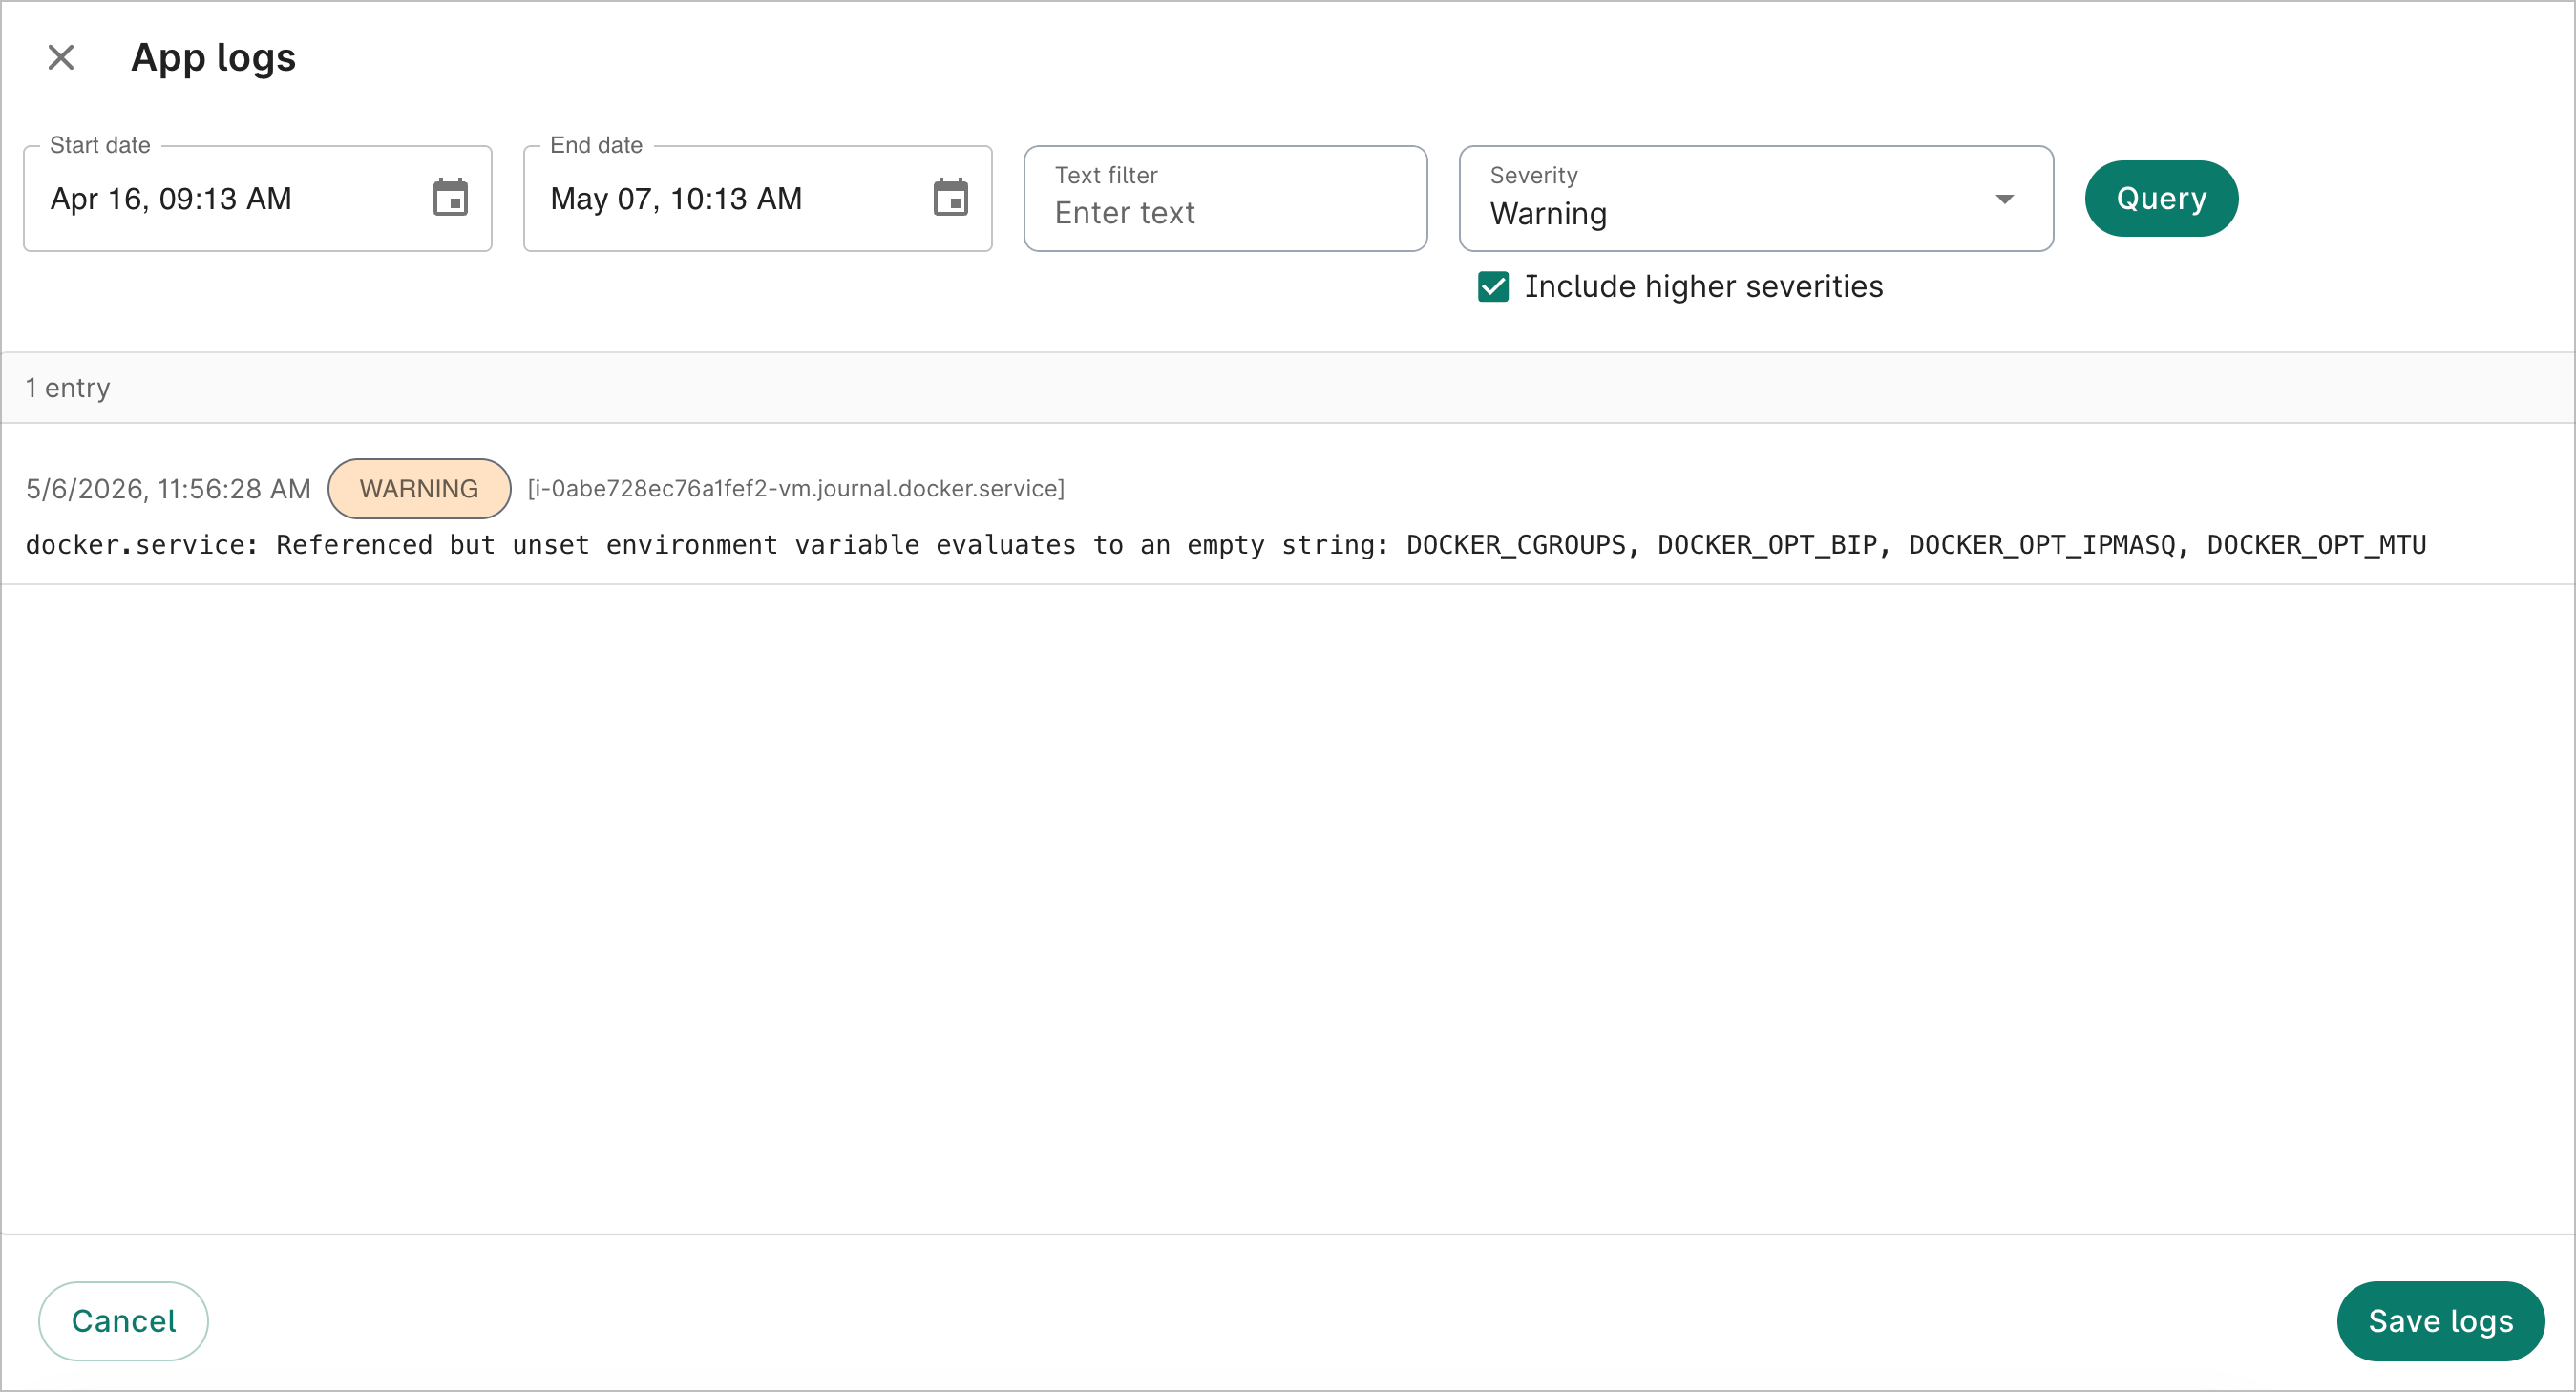
Filter logs by time and date, text, and/or severity. -
If you'd like, you can export the logs to a controlled bucket in your workspace. Click Save logs in the lower right and select a bucket to export to. Click Export.
Use the wb app logs command to run logs-related
actions.
In the examples below, replace the options with relevant values. For the --start-time and
--end-time options, values must be in UTC.
# Query for logs
wb app logs \
--workspace=my-workspace \
--id=my-app \
--start-time=2026-04-30T19:04:19.234Z \
--end-time=2026-04-30T20:04:19.234Z \
--format=JSON

# Query with relative time
wb app logs \
--workspace=my-workspace \
--id=my-app \
--format=JSON \
--since=5d

# Query with text filter
wb app logs \
--since=5d \
--workspace=my-workspace \
--id=my-app \
--format=JSON \
--filter="vm.journal.startup"

# Export to bucket. The --output-bucket must be a controlled bucket in the same workspace as your app.
wb app logs \
--since=5d \
--workspace=my-workspace \
--id=my-app \
--format=JSON \
--filter="vm.journal.startup" \
--output-bucket=my-bucket
Use app logs to diagnose crashes
App logs can help confirm if an app crash was memory-related and how much memory the workload needed.
VM memory issues
The most relevant log source for VM memory issues is vm.journal.stats, which reports the following
metrics:
-
VM-level
memory_usage_ratio— Proportion of total VM RAM currently in use (0.0 to 1.0). This is the primary indicator of memory pressure.memory_used_bytes— Absolute RAM in use. Useful for understanding how much memory a workload actually needs, independent of VM size. -
Disk fields (per mounted device)
Each entry includes a disks array. A typical VM has two disks:
mountpoint: / — The root filesystem.
usage_ratioshows how full it is.mountpoint: /var/lib/docker — Docker storage. Contains container images and layers.
Each disk reports
total_bytes,used_bytes, andusage_ratio.
Container memory issues
The most relevant log source for container memory issues is application-server, which reports the
following metrics:
-
Container-level
memory_usage_ratio— Memory consumed by the container as a proportion of total VM RAM. In memory-related crashes, this container drives nearly all of the VM-level usage.state.oom_killed— Whether Docker recorded an out-of-memory kill on the container.
Common scenarios
These scenarios detail typical memory and disk space-related issues:
-
Sudden memory drop after high usage (out-of-memory crash)
If
memory_usage_ratiois above 0.70 in one log entry and drops below 0.30 in the next (approx. 1 minute later), that likely means the kernel was killed and memory was released. This is the most reliable indicator of an out-of-memory crash, even whenoom_killedreads false. -
Steady memory ramp approaching 85+ percent
If
memory_usage_ratioincreases by 0.05–0.10 per minute over consecutive entries, the user is loading a large object and may be heading toward an out-of-memory crash. Values above 0.85 indicate the VM is at immediate risk. -
Disk pressure
If the root disk's
usage_ratiois above 0.90, the VM is running out of disk space. This can cause notebook save failures, package install errors, or inability to write output files.
Last Modified: 11 August 2026